
Dr Philip E Dunn gives you the insight to be able to handle questions on this topic with confidence.
The appraisal of a planned investment is a demanding decision that the accountant has to face in today’s fast-moving business environment.
Projects are usually complex and carry an element of risk, but also have the potential of offering ‘added value’ and underpin the achievement of strategic aims. Accountants owe it to themselves, shareholders and employees to see that the approach to the investment of funds is based on sound financial techniques.
Much analysis in the past has been based on conventional financial appraisal models, including average return on capital, payback period, and discounted cash flow.

Research by Professor Frank Lefley and his development of the Financial Appraisal Profile Model (FAP) extended traditional methods to a new dimension. The development includes terms such as NPVP (net present value profile); DPB (discounted payback); DPBI (discounted payback index); and MGR (marginal growth rate).
So what are the main factors to take into account when evaluating projects when there is a choice to be made? They are the amount of capital available, the cost of the capital, the cash flow from the project or projects and its timing, capital allowances and taxation, grants, residual value of the assets, and risk.
Any appraisal should, in addition to these factors, address two fundamental issues: the long-term TSR (total shareholder return) and project liquidity. The following mini case study illustrates the use of the methods and techniques listed above:
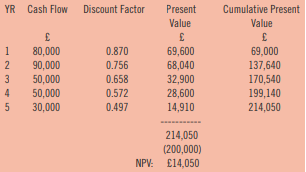
Hawsker Engineering Services is considering investing £200,000 in hi-tech machinery that will generate incremental business. The anticipated cash flows from the project over the next five years are: Yr1 £80,000; Yr2 £90,000; Yr3 £50,000; Yr4 £50,000; Yr5 £30,000.
NPVP – net present value profile
The schedule below shows the project under consideration with a capital cost of £200,000 and will be appraised over the first five years. The firm’s cost of capital is 15% and uses this percentage in discounting the projects future cash flows. Schedule of NPVP: NPVP = NPV–DPB–DPBI–MGR NPV:
Net Present Value (NPV)
With a capital cost of £200,000 and a total discounted cash flow of £214,050 the project has a positive NPV of £14,050, and is therefore achieving a discounted cash flow return greater than 15%.
Discounted Payback (DPB)
The cumulative present value of the future cash flows at the end of the fourth year is £199,140, and the company needs to achieve a further £860 of the discounted cash flow for year five to arrive at the point of payback. 4 Years + (860/14910 x 12) = 4 Years and 0.7 months The company will have recovered the whole of the cost and financing of the project in just over four years.
Discounted Payback Index (DPBI)
A further step beyond the DPD is the calculation of the DPBI. It is calculated by dividing the project’s initial capital cost into its accumulated discounted net cash flows. It indicates how many times the initial cost of the investment will be covered over the period of the appraisal. In this case the calculation is £214,050/£200,000 = 1.07. This shows that the project over the period of the appraisal recovers its original cost just over once and is an indicator of the projects profitability. This measure now referred to as DPBI was the former PI (profitability index) covered by a number of writers in the past.
Marginal growth rate (MGR)
Professor Lefley sees this as the final stage in the development of the NPVP model and states: MGR = ((DPBI)1/n -1) x 100 MGR = ((1.07)1/5 -1) x100 = 1.36% The MGR is the average annual growth rate of the project after discounting the project at 15%.
Lefley views this as ‘a net variant of the modified internal rate of return’. Thus, with a positive NPV of £14,050, a DPB of 4 years 0.7 months, a DPBI of 1.07 and a MGR of 1.36%, the project would be acceptable.
At this point it is also interesting to determine the IRR (internal rate of return), the more conventional approach to benchmark the DCF return, with the cost of capital. It is that rate at which the NPV would be equal to zero.
Having discounted the project at 20% the cumulative net present value of the future cash flows was £194,130.
This results in a NPV of -£5,870 (£194,130 – £200,000). The IRR is determined as: Lower Rate % + (NPV at Lower Rate/Range of NPV x Range of Rates) 15 + (14,050/19,920 x 5) = 18.53%.
The project’s IRR is in excess of the cost of capital and a further indicator that the project should be adopted.
• Dr Philip E Dunn is a freelance author and technical editor for Kaplan and Osborne Books
