

May 2020
Phil Dunn explains all you need to know about the balanced scorecard.
Performance measurement has been defined as: “A process of assessing progress towards achieving pre-determined goals, including information, the efficiencies with which resources are transformed into goods and services (outputs), the quality of those outputs (how well they are delivered to clients and the extent to which clients are satisfied) and outcomes (the results of a progress activity compared with its intended purpose).”
Performance measurement underpins performance management, which simply uses the information in the form of performance indicators (PIs) to effect positive change across the organisation so that management achieve their corporate objectives.

There is a need for a structured methodology to aid the setting of managers’ objectives.
Many organisations use the balanced scorecard framework. The concept was developed by (R Kaplan and D Norton, 1993) at Harvard. It is a device for planning which uses a balanced rather than a skewed approach, so enabling managers to set a range of targets with appropriate objectives.
The framework translates an organisation’s strategy to set performance indicators across four perspectives: financial, customer, internal business process and growth.
Balanced scorecard
Strategic perspectives
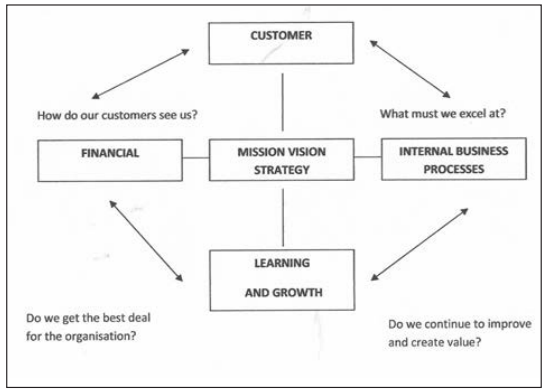
Financial perspective: This focuses on satisfying shareholder value added, and measures would include return on capital employed (ROCE) and the percentage profit margin.
Customer perspective: This is an attempt to measure customers’ views of the organisation by measuring customer satisfaction. Examples would include customer satisfaction with timeliness and customer loyalty.
Internal perspective: This aims to measure the organisation’s output in terms of technical excellence and consumer needs. Indicators would include unit costs and total quality measurement.
Innovation and learning perspective: This focuses on the need for continual improvement of existing products and developing new ones to meet customers changing needs. A measure would include percentage of turnover attributable to new products.
The following is an Extract from the Financial Statements of Coverdrive Ltd together with additional notes for Year Ended X19.
| Coverdrive Ltd | £m |
| Turnover | 3.20 |
| Cost of Sales | 2.40 |
| Gross Profit | 0.80 |
| Admin and dist cost | 0.20 |
| Profit before taxation | 0.60 |
Additional notes:
Total assets less current liabilities £3.1m Turnover: existing products £2.24, new products £0.96 of which £2.10m is to existing customers.
Included in the total costs are those relating to: Research and development £0.26, training £0.31, quality assurance £0.12 and customer support £0.08.
From this summary we can develop a series of key performance indicators (KPIs), relevant to the four perspectives focused in the balanced scorecard:
• Financial perspective. Return on capital employed. % net profit to turnover (based on profit before taxation).
• Customer perspective. Customer support as a % of turnover. % of business to existing customers.
• Internal perspective. Quality assurance as a % of turnover. Admin and dist cost as a % of turnover.
• Innovation and learning perspective. Training costs as a % of total cost. % of turnover attributable to new products.
An analysis of the Coverdrive Financial Statements extract shows:
• Financial perspective: return on capital employed 19.4%, % net profit to turnover 18.8%.
• Customer perspective: customer support as a % of turnover 2.5%, % of business to existing customers 65.6%.
• Internal perspective: quality assurance as a % of turnover 3.8%, admin and dist cost as a % of turnover 6.3%.
• Innovation and learning perspective: training costs as a % of total cost 11.9%, % of turnover attributable to new products 30%.
Coverdrive should include such KPIs in its budgetary process and compare budget with actual performance on a rolling basis.
It will also use such an analysis on a year-on-year basis. It would have been most useful to have included in this short introduction to this topic Financial Statements, say for a three-year period, but unfortunately this was not possible due to lack of space.
• Dr Philip E Dunn is a freelance author and assessor, Kaplan Distance Learning.
